-
Battery, EV, Energy Storage System
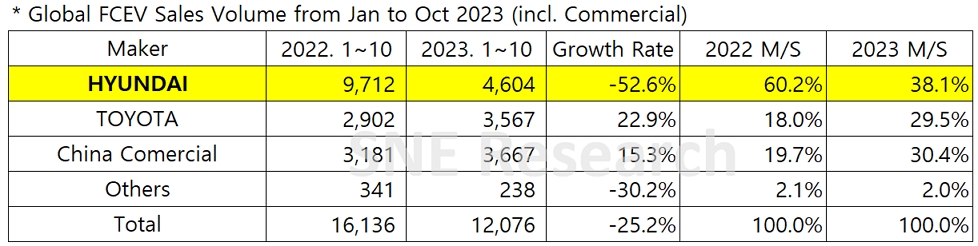
From Jan to October 2023, Global FCEV Market with a 25.2% YoY Degrowth
2023.12.12 -
Battery, EV
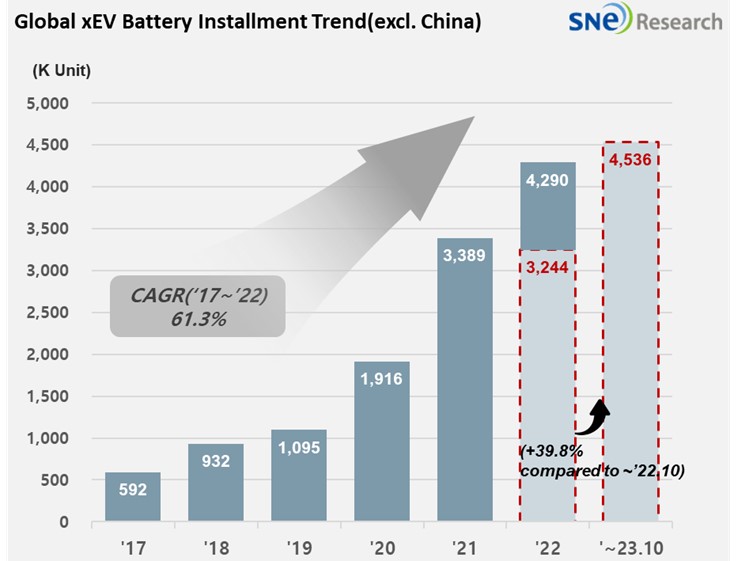
From Jan to Oct in 2023, Non-China Global Electric Vehicle Deliveries Posted 4.536 Mil Units
2023.12.11 -
Battery, EV
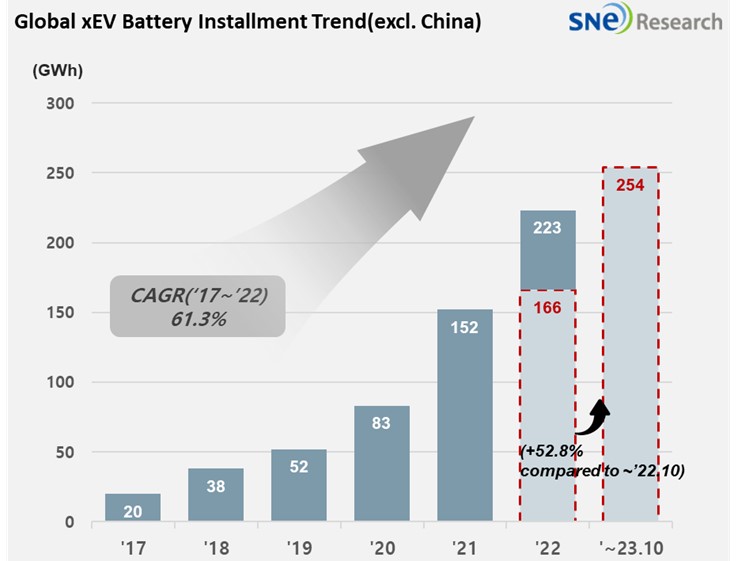
From Jan to Oct in 2023, Non-Chinese Global EV Battery Usage Posted 254.5GWh, a 52.8% YoY Growth
2023.12.08 -
Battery, EV
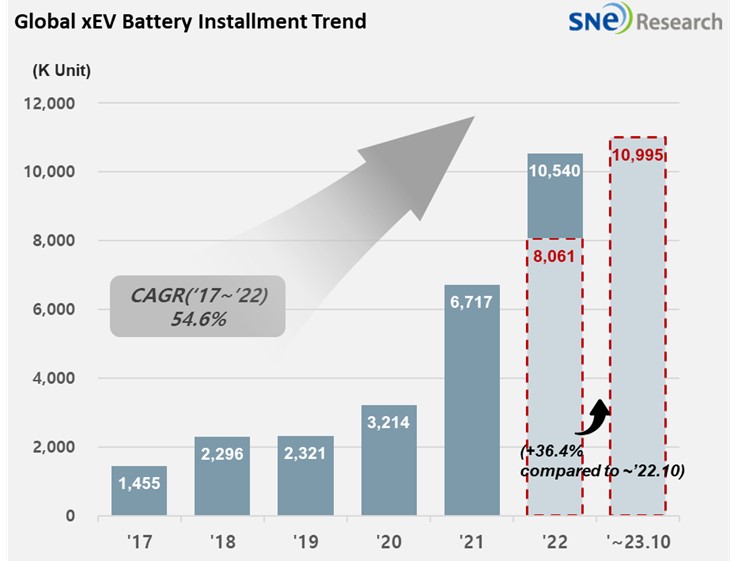
From Jan to Oct in 2023, Global Electric Vehicle Deliveries Posted 10.995 Mil Units, a 36.4% YoY growth
2023.12.07 -
Battery, EV
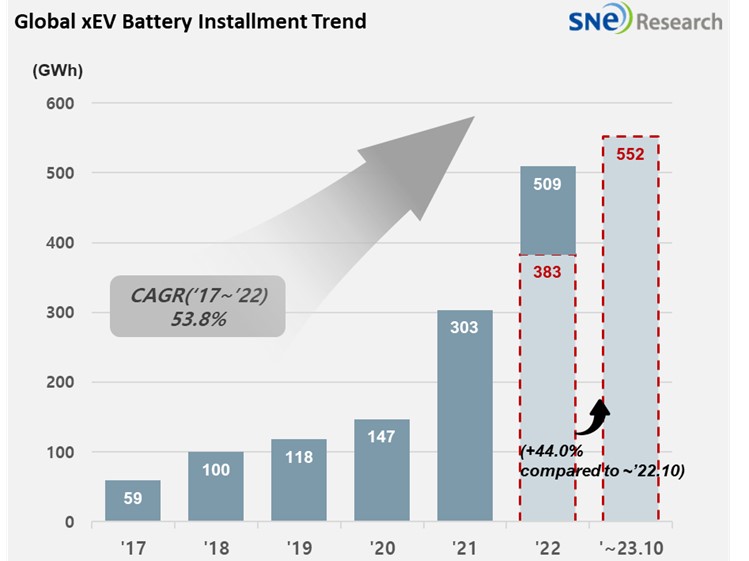
From Jan to Oct in 2023, Global EV Battery Usage Posted 552.2GWh, a 44.0% YoY Growth
2023.12.06 -
Battery, EV, Emerging Industry
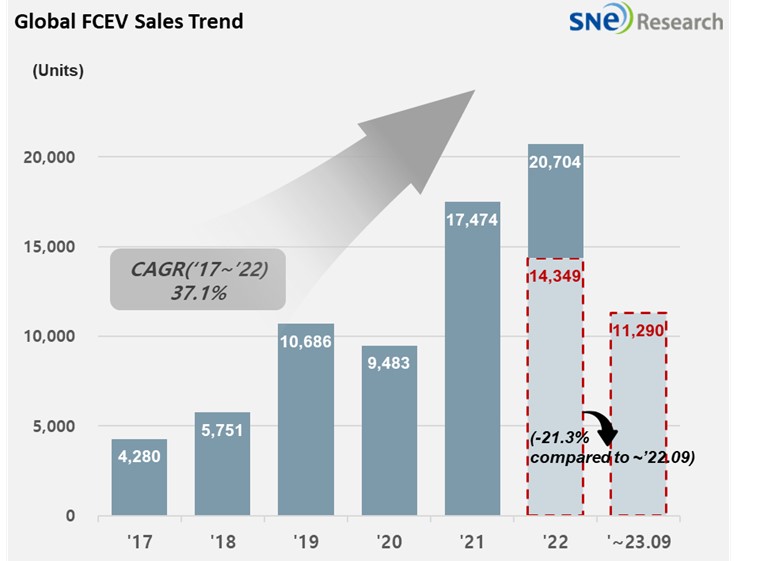
From Jan to September 2023, Global FCEV Market with a 21.3% YoY Degrowth
2023.11.20 -
Battery, EV
Global Electric Vehicle Deliveries in 2023 Expected to Record 13.77 Mil Units and a 30.6% YoY Growth, Leading to Possible Chance of Mild Downturn in EV Market
2023.11.16 -
Battery, EV
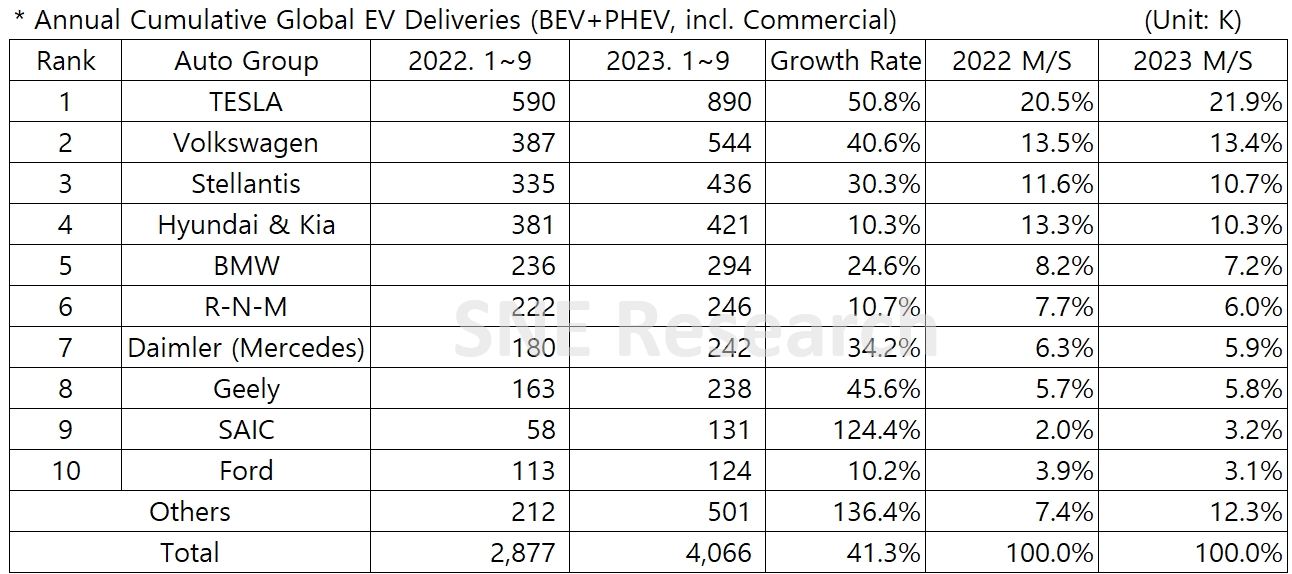
From Jan to Sep in 2023, Non-China Global Electric Vehicle Deliveries Posted 4.066 Mil Units, a 41.3% YoY Growth
2023.11.10 -
Battery, EV
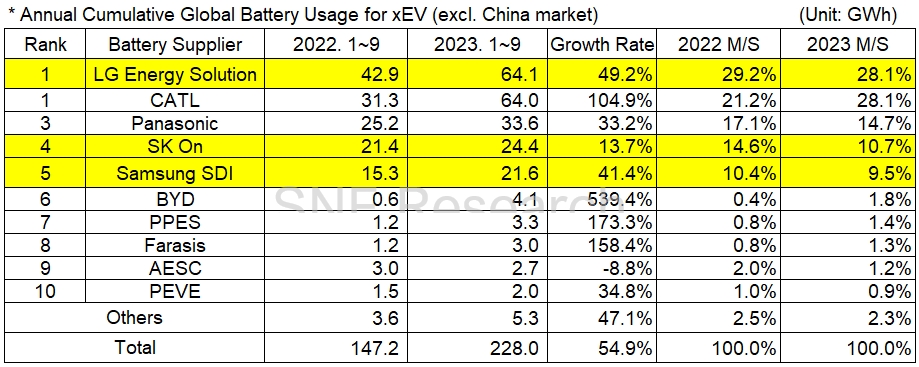
From Jan to September in 2023, Non-Chinese Global EV Battery Usage Posted 228.0GWh, a 54.9% YoY Growth
2023.11.09 -
Battery, EV
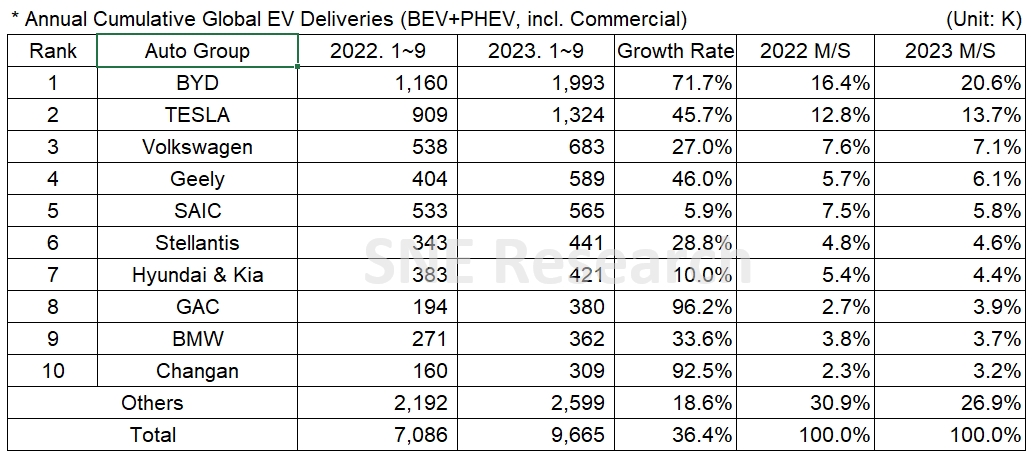
From Jan to Sep in 2023, Global Electric Vehicle Deliveries Posted 9.665 Mil Units , a 36.4% YoY Growth
2023.11.08 -
Battery, EV
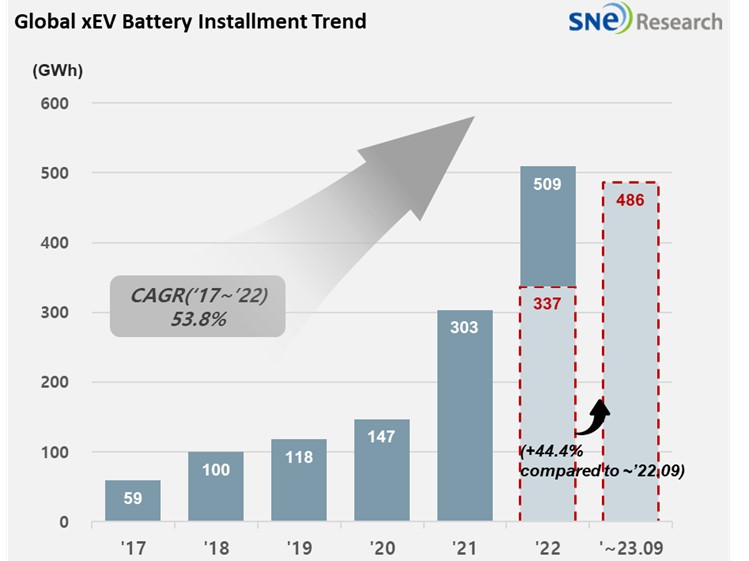
From Jan to Sep in 2023, Global EV Battery Usage Posted 485.9GWh , a 44.4% YoY Growth
2023.11.07 -
Battery, Emerging Industry
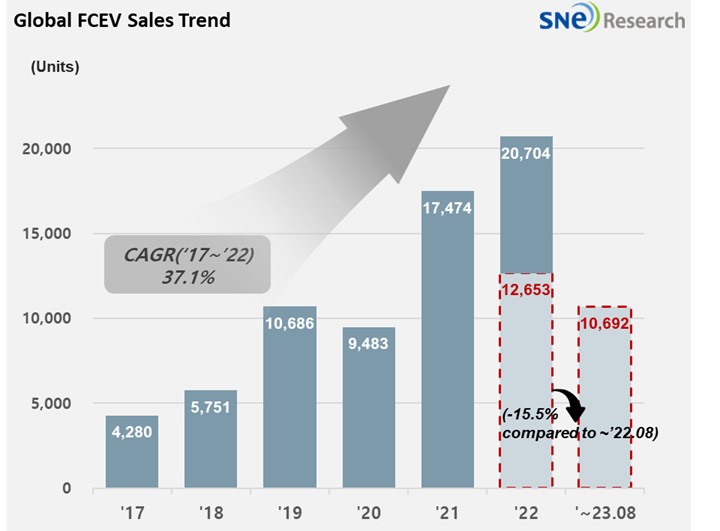
From Jan to August 2023, Global FCEV Market with a 15.5% YoY Degrowth
2023.10.17
Read news articles carefully picked by our professional analysts and get the most up-to-date market insight.
New Press
Battery, Battery Materials
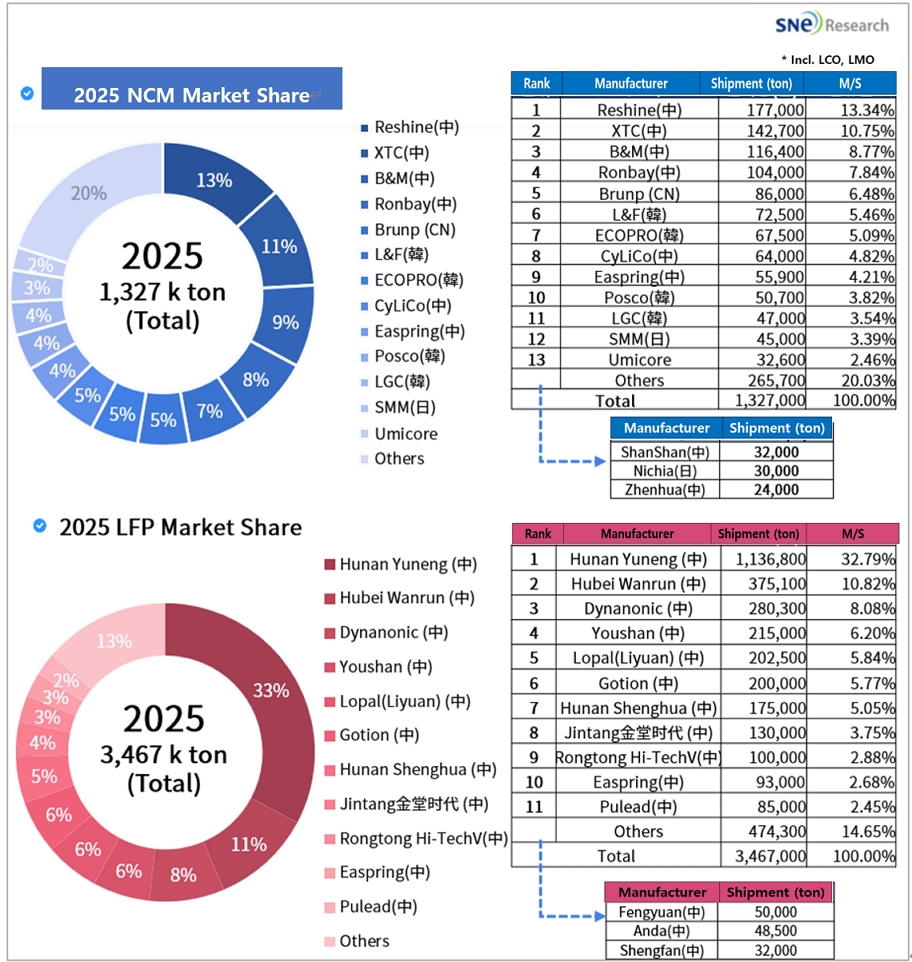
LFP Dominates Cathode Market with 72% Share in 2025, Up 19% from 2023; Strong Momentum Projected to Continue This Year
LFP Dominates Cathode Market with 72% Share
in 2025, Up 19% from 2023; Strong Momentum Projected to Continue This Year
ü Reshine Claims Top
Spot in 2025 Ternary Cathode Shipments with 177K Tons; Hunan Yuneng Monopolizes
LFP Sector at 1.14M Tons, Driving Aggressive Capacity Expansion This Year ü China’s
High-Nickel Giant Ronbay Supplies Over 80K Tons of High-Ni (≥80%) Cathodes to
CATL, Yet Slips to 4th in Overall Ternary Shipments ü Te
2026.06.17
Battery, Battery Materials, EV
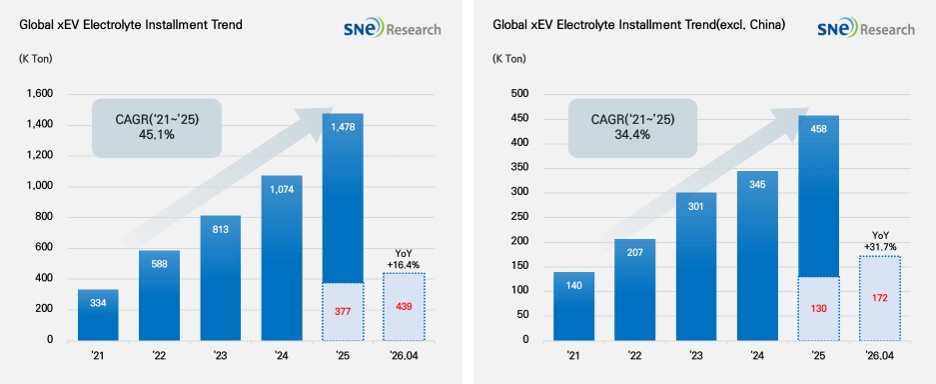
From Jan to Apr 2026, Global Electric Vehicle Battery Electrolyte Installment Reached 439K ton
From Jan to Apr
2026, Global[1]
Electric Vehicle Battery Electrolyte Installment[2] Reached
439K ton, a 16.4% YoY Growth
- From Jan to Apr
2026, the installment of electrolyte outside China reached 172k ton, a 31.7% YoY growth. (Source: 2026 May Global EV & Battery Monthly Tracker (Incl. LiB 4 Major Materials), SNE Research) From January to April 2026, the global installation volume of electrolytes for electric vehicles (EV, PHEV, HEV) registered worldwide reached approxima
2026.06.12
Battery, Battery Materials, EV
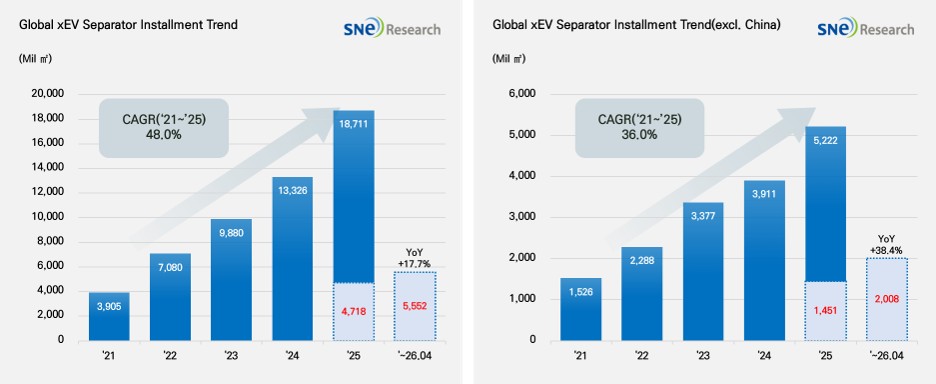
From Jan to Apr 2026, Global EV Battery Separator Installment Reached 5,552Mil ㎡, a 17.7% YoY Growth
From Jan to Apr 2026, Global[1] EV
Battery Separator Installment[2] Reached
5,552Mil ㎡, a 17.7% YoY Growth -
Chinese separator makers accounted for 89.6%
M/S; China Maintains Dominance in Global Supply Structure(Source: 2026 May Global EV & Battery Monthly Tracker (Incl. LiB 4 Major Materials), SNE Research) From January to April 2026, the installation volume of battery separators for electric vehicles (EV, PHEV, HEV) registered in co
2026.06.11
Battery, Battery Materials, EV
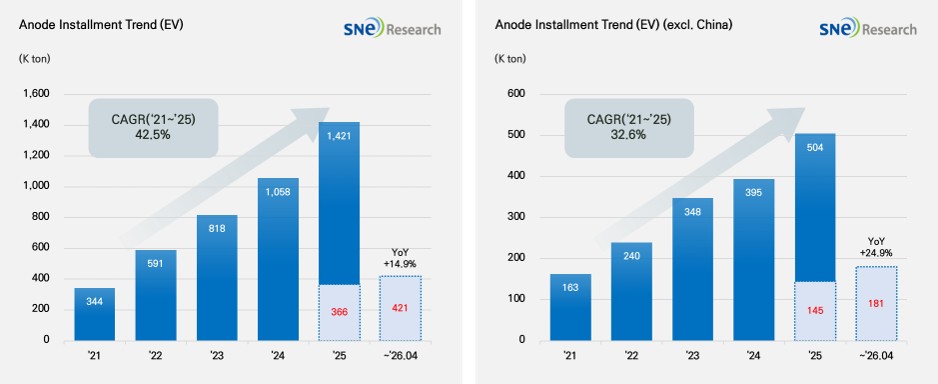
From Jan to Apr 2026, Global EV Battery Anode Installment Reached 421K ton, a 14.9% YoY Growth
From Jan to Apr 2026, Global EV Battery Anode
Installment Reached 421K ton, a 14.9% YoY Growth
- Anode installment in the non-China market
recorded 181K ton, a 24.9% YoY Growth (Source: 2026 May Global EV & Battery Monthly Tracker (Incl. LiB 4 Major Materials), SNE Research) From January to April 2026, the global installation volume of anode materials for electric vehicles reached 421K tons, marking a 14.9% increase compared to the 366K tons recorded in the same period of 2025
2026.06.10
Battery, Battery Materials, EV
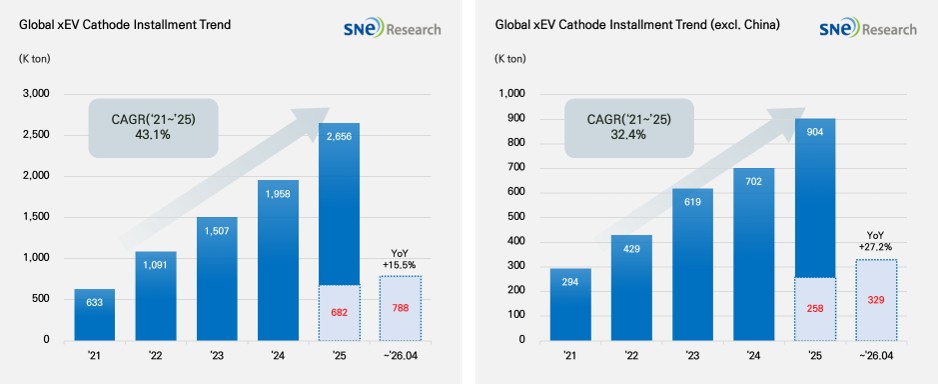
From Jan to Apr 2026, Global EV Battery Cathode Installment Reached 788K ton, a 15.5% YoY Growth
From Jan to Apr 2026, Global EV Battery
Cathode Installment Reached 788K ton, a 15.5% YoY Growth
- EV battery cathode installment in the
non-China market recorded 329K ton, a 27.2% YoY growth (Source: 2026 May Global EV & Battery Monthly Tracker (Incl. LiB 4 Major Materials), SNE Research) Global demand for EV cathode materials continued its growth trajectory through the first four months of 2026. From January to April 2026, the global installation volume of cathode materials
2026.06.09