

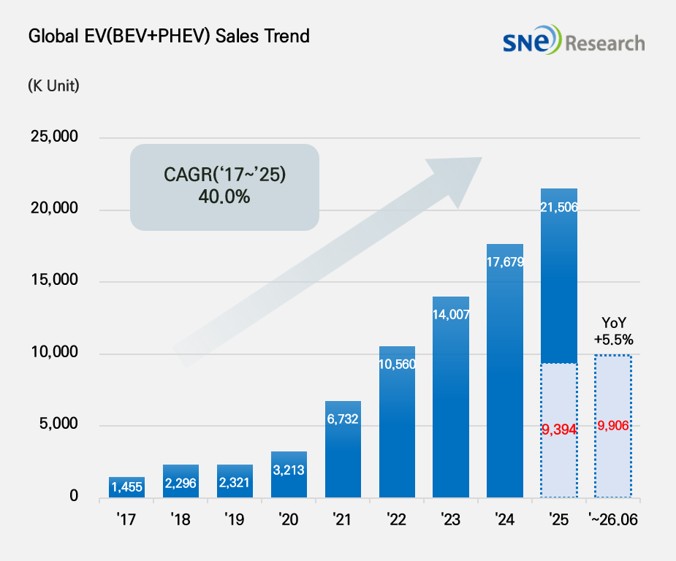
From Jan to June 2026, Global Electric Vehicle Deliveries Recorded 9.906 Mil Unit, a 5.5% YoY Growth
- Europe and Asia (excl. China) demonstrate strong growth, while global EV market expands by 5.5% despite a slowdown in China and North America
(Source: Global EV and Battery Monthly
Tracker – July 2026, SNE Research)
During the first half of 2026, global
electric vehicle (EV, including BEV and PHEV) deliveries totaled 9.906 million
units, marking a 5.5% increase year-over-year. While the market sustained a
modest expansion overall during the first half, performance trajectories
diverged sharply across key regions. Contractions in China and North America
were offset by double-digit growth in Europe, Non-China Asia, and other
emerging markets, reflecting a broader diversification of gravity in global
demand.
(Source: Global EV and Battery Monthly Tracker – July 2026, SNE Research)
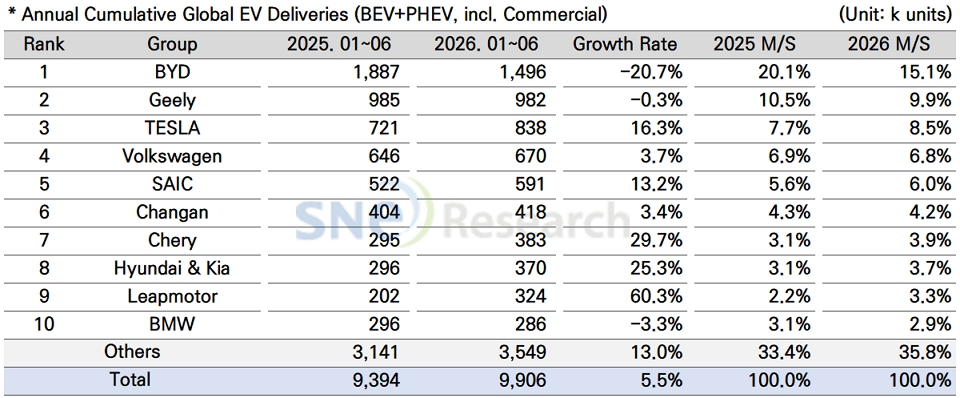
In global EV deliveries by OEM group during the first half of 2026, BYD retained its top spot with 1.496 million units delivered, despite a 20.7% decline year-over-year. Consequently, its market share contracted by 5.0 percentage points from 20.1% to 15.1%. While sluggish domestic demand in China weighed on its cumulative performance, a rebound in BEV sales in the second quarter and expanding overseas deliveries centered on Europe, Southeast Asia, and Latin America are evaluated as key variables supporting a potential recovery in the second half.
Geely climbed to second place with 982,000 units, staying roughly flat (-0.3%) compared to the previous year. Tesla secured third place with 838,000 units, representing a 16.3% increase year-over-year, which pushed its market share up from 7.7% to 8.5%. Strong delivery volume of 480,126 units in the second quarter bolstered its first-half growth momentum. Volkswagen logged 670,000 units (+3.7%), continuing a modest upward trajectory propelled by expanding European BEV demand and new model rollouts.
Among major Chinese OEMs, SAIC recorded 591,000 units (+13.2%), while Changan posted 418,000 units (+3.4%). Chery reached 383,000 units, marking a 29.7% increase, supported by sustained expansion in overseas markets. Hyundai Motor Group recorded 370,000 units, up 25.3% year-over-year—outpacing most top-tier peers in growth rate—and saw its market share rise from 3.1% to 3.7%. This performance improvement is attributed to a recovery in European sales and robust demand across non-Chinese Asian regions.
Leapmotor recorded a steep 60.3% surge year-over-year to reach 324,000 units, capturing the highest growth rate among the top ten OEM groups and expanding its market share from 2.2% to 3.3%. Its global expansion leveraging Stellantis’ distribution networks alongside lineup diversification are also elevating growth expectations moving forward. Conversely, BMW posted 286,000 units, marking a slight decline of 3.3% year-over-year.
Combined deliveries from OEMs outside the top ten groups grew 13.0% to 3.549 million units, raising their collective market share from 33.4% to 35.8%. As select market leaders stalled, region-specific OEMs and emerging brands expanded their footprints at a rapid pace, underscoring a clear shift toward a more multipolar competitive landscape.
(Source: Global EV and Battery Monthly
Tracker – July 2026, SNE Research)
By
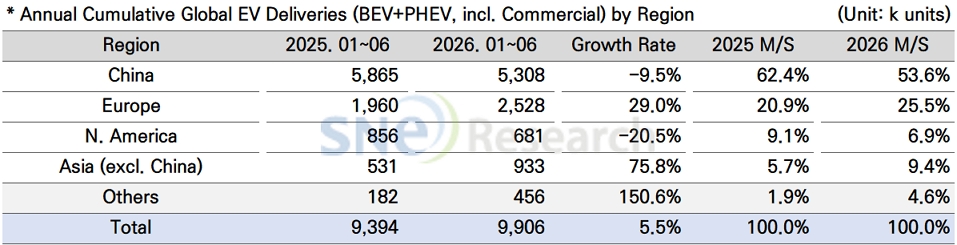
region, China maintained its position as the world's largest market with 5.308
million units delivered, but recorded a 9.5% decline year-over-year.
Consequently, its market share contracted by 8.8 percentage points from 62.4%
to 53.6%. This drop is attributed to the backlash from pre-buys ahead of
reduced purchase tax exemptions in late 2025, scaled-back tax incentives in
2026, and fierce price competition, which collectively weighed on first-half
demand.
Europe
grew 29.0% year-over-year to 2.528 million units, elevating its market share
from 20.9% to 25.5%. Demand was sustained by compliance with stricter emissions
regulations, new vehicle launches, and national-level incentives. First-half
data released by the ACEA in July also showed the BEV share in EU passenger
cars expanding to 20.7%, underscoring the widespread adoption of
electrification across the market.
North
America posted the weakest performance among major regions, declining 20.5% to
681,000 units and pushing its market share down from 9.1% to 6.9%. Demand
recovery remained constrained due to heightened purchasing burdens following
the expiration of U.S. clean vehicle tax credits for new, used, and commercial
vehicles in late September 2025, compounded by high vehicle prices and model
refresh cycles.
Non-China
Asia emerged as the fastest-growing core axis, surging 75.8% to 933,000 units
and expanding its market share from 5.7% to 9.4%. This momentum was driven by a
confluence of new model rollouts, localized production, and adoption policies
across South Korea, India, and Southeast Asia. Other regions also jumped 150.6%
to 456,000 units, as early-stage adoption across emerging markets in Latin
America and the Middle East lifted overall global growth.
Although
the global EV market expanded by 5.5% during the first half of 2026,
performance gaps across regions and automakers widened further. Despite
adjustments in China and North America, regions such as Europe, Non-China Asia,
and other emerging markets generated new demand. Manufacturers including Tesla,
Hyundai Motor Group, Chery, and Leapmotor expanded their market share through
double-digit growth. Conversely, while BYD and Geely were impacted by the
slowdown in the Chinese domestic market, they are fortifying their foundation
for a rebound by expanding overseas production and sales operations.
Looking
ahead to the second half, the market trajectory is projected to hinge on the
pace of demand normalization in China, the lingering aftermath of the expired
U.S. tax credits, and the sustainability of European growth momentum. Notably,
the EU's first-half BEV market share reaching 20.7% (released in July)
alongside BYD’s announcement to establish an overseas ultra-fast charging
network within the year demonstrate that competition is expanding beyond simple
sales volumes into localized production, charging infrastructure, and supply
chain ecosystem integration. Consequently, the speed of localization and cost
competitiveness across individual OEMs are expected to serve as the critical
variables shaping market share shifts in the second half.